my country’s total import and export value today is one trillion yuan
According to customs statistics, in the first seven months of this year, my country’s total import and export value was 13.21 trillion yuan, a decrease of 3% compared with the same period last year (the same below). Among them, exports were 7.6 trillion yuan, down 1.6%; imports were 5.61 trillion yuan, down 4.8%; the trade surplus was 1.99 trillion yuan, an increase of 8.7%.
In July, my country’s total import and export value was 2.09 trillion yuan, down 0.9%. Among them, exports were 1.22 trillion yuan, an increase of 2.9%; imports were 873 billion yuan, a decrease of 5.7%; the trade surplus was 342.8 billion yuan, an increase of 34%.
In the first seven months, my country’s foreign trade import and export mainly showed the following characteristics:
1. The proportion of imports and exports in general trade has increased. In the first seven months, my country’s general trade import and export volume was 7.47 trillion yuan, a decrease of 0.7%, accounting for 56.5% of China’s total foreign trade value, an increase of 1.3 percentage points from the same period last year. Among them, exports were 4.24 trillion yuan, an increase of 0.8%, accounting for 55.7% of the total export value; imports were 3.23 trillion yuan, a decrease of 2.6%, accounting for 57.6% of the total import value; the surplus under general trade was 1.01 trillion yuan, an expansion of 13.6% . During the same period, my country’s processing trade import and export volume was 3.82 trillion yuan, down 9.2%, accounting for 28.9% of China’s total foreign trade value, down 2 percentage points from the same period last year. Among them, exports were 2.47 trillion yuan, down 7.8%, accounting for 32.5% of the total export value; imports were 1.35 trillion yuan, down 11.7%, accounting for 24% of the total import value; the surplus under processing trade was 1.12 trillion yuan, narrowing by 2.7%. %.
In addition, my country’s import and export under special customs supervision was 1.42 trillion yuan, a decrease of 1.2%, accounting for 10.7% of China’s total foreign trade value. Among them, exports were 504.76 billion yuan, down 2.3%, accounting for 6.6% of the total export value; imports were 914.04 billion yuan, down 0.6%, accounting for 16.3% of the total import value.
2. Imports and exports to trading partners such as the EU and Japan increased, while imports and exports to the United States, ASEAN and other countries declined. In the first seven months, the EU was my country’s largest trading partner. The total value of China-EU trade was 2.01 trillion yuan, an increase of 1.8%, accounting for 15.2% of China’s total foreign trade value. Among them, China’s exports to the EU were 1.24 trillion yuan, an increase of 1.7%; China’s imports from the EU were 771.58 billion yuan, an increase of 2.1%; the trade surplus with Europe was 465.54 billion yuan, an increase of 1%. The United States is my country’s second largest trading partner. The total value of Sino-US trade was 1.83 trillion yuan, a decrease of 4.8%, accounting for 13.8% of China’s total foreign trade value. Among them, China’s exports to the United States were 1.35 trillion yuan, a decrease of 3.1%; China’s imports from the United States were 473.82 billion yuan, a decrease of 9.3%; the trade surplus with the United States was 877.91 billion yuan, an increase of 0.6%.
In the first seven months, ASEAN was my country’s third largest trading partner. The total trade value with ASEAN was 1.61 trillion yuan, a decrease of 2.2%, accounting for 12.2% of China’s total foreign trade value. Among them, China’s exports to ASEAN were 944.92 billion yuan, a decrease of 1.6%; China’s imports from ASEAN were 660.23 billion yuan, a decrease of 3.1%; the trade surplus with ASEAN was 284.69 billion yuan, an increase of 2.1%. Japan is my country’s fifth largest trading partner. The total trade value between China and Japan was 983.57 billion yuan, an increase of 0.8%, accounting for 7.4% of China’s total foreign trade value. Among them, exports to Japan were 469.78 billion yuan, a decrease of 0.2%; imports from Japan were 513.79 billion yuan, an increase of 1.7%; the trade deficit with Japan was 44.01 billion yuan, an increase of 27.6%.
3. The import and export of private enterprises increased and their proportion increased. In the first seven months, the import and export of private enterprises was 5.12 trillion yuan, an increase of 4.8%, accounting for 38.8% of China’s total foreign trade value, an increase of 2.9 percentage points compared with the same period last year. Among them, exports were 3.55 trillion yuan, an increase of 3.6%, accounting for 46.7% of the total export value; imports were 1.57 trillion yuan, an increase of 7.6%, accounting for 27.9% of the total import value. During the same period, the import and export of foreign-invested enterprises was 5.98 trillion yuan, a decrease of 6.1%, accounting for 45.3% of China’s total foreign trade value. Among them, exports were 3.25 trillion yuan, down 5.6%, accounting for 42.8% of the total export value; imports were 2.73 trillion yuan, down 6.6%, accounting for 48.6% of the total import value.
In addition, the import and export of state-owned enterprises was 2.05 trillion yuan, a decrease of 12%, accounting for 15.5% of our total foreign trade value. Among them, exports were 789.87 billion yuan, down 6.8%, accounting for 10.4% of the total export value; imports were 1.26 trillion yuan, down 14.9%, accounting for 22.5% of the total import value.
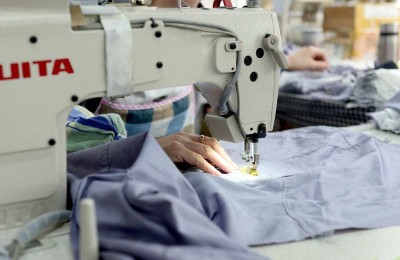
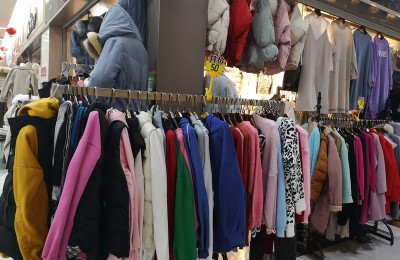
4. The export of mechanical and electrical products declined, while the export of some traditional labor-intensive products such as textiles increased. In the first seven months, my country’s exports of mechanical and electrical products were 4.33 trillion yuan, a decrease of 1.9%, accounting for 57% of the total export value. Among them, the export of electrical appliances and electronic products was 1.93 trillion yuan, an increase of 0.6%; the export of machinery and equipment was 1.26 trillion yuan, a decrease of 2.2%. During the same period, clothing exports were 569.5 billion yuan, a decrease of 0.2%; textiles were 397.5 billion yuan, an increase of 3.9%; footwear exports were 179.13 billion yuan, a decrease of 5.7%; furniture exports were 179.73 billion yuan, a decrease of 4.4%; plastic products were 134.65 billion yuan, an increase of 4.4%; Luggage and luggage were 95.46 billion yuan, a decrease of 4.1%; toys were 53.25 billion yuan, an increase of 14.5%; the total exports of the above seven categories of labor-intensive products were 1.61 trillion yuan, an increase of 0.2%, accounting for 21.2% of the total export value. In addition, fertilizer exports were 14.98 million tons, a decrease of 23.5%; steel products were 67.41 million tons, an increase of 8.5%; and automobiles were 410,000 tons, a decrease of 8.7%.
5. The import volume of major commodities such as iron ore, crude oil and copper increased, and the prices of major imported commodities generally fell. In the first seven months, my country imported 582 million tons of iron ore, an increase of 8.1%, and the average import price was 337.6 yuan per ton, a decrease of 13.3%; crude oil was 218 million tons, an increase of 12.1%, and the average import price was 337.6 yuan per ton. 1852.1 yuan, down 29.6%; coal was 129 million tons, up 6.7%, the average import price was 315.3 yuan per ton, down 18.8%; refined oil was 17.55 million tons, down 3.4%, and the average import price was 2475.8 yuan per ton, down 20.3 %; plastics in primary shapes were 14.37 million tons, a decrease of 6%, and the average import price was 10,300 yuan per ton, a decrease of 4.4%; steel products were 7.59 million tons, a decrease of 1.4%, and the average import price was 6,471.2 yuan per ton, a decrease of 9.4%; Not yet�Rolled copper and copper products were 3.09 million tons, an increase of 19.5%, and the average import price was 33,700 yuan per ton, a decrease of 14.9%.
In addition, the import of mechanical and electrical products was 2.71 trillion yuan, a decrease of 1.7%; of which 570,000 cars were imported, a decrease of 9.9%.
6. China’s foreign trade export leading index rebounded. In July, China’s foreign trade export leading index was 33.8, an increase of 1.1 from the previous month, indicating that export pressure is expected to ease at the beginning of the fourth quarter. Among them, according to online questionnaire survey data, my country’s export managers’ index was 36.9 that month, rising by 1; the new export orders index and manager confidence index rose by 0.9 and 2.2 respectively to 36.3 and 42.4, and the enterprise comprehensive cost index fell by 1. to 28.
AAA
Disclaimer:
Disclaimer: Some of the texts, pictures, audios, and videos of some articles published on this site are from the Internet and do not represent the views of this site. The copyrights belong to the original authors. If you find that the information reproduced on this website infringes upon your rights and interests, please contact us and we will change or delete it as soon as possible.
AA